Scripts that you have started from within the LCC (as well as the middleware) are managed using tmux sessions (which is similar to screen).
Tmux is used to create, manage and kill virtual console sessions, which can be used for any purpose a console can take care of - in this case e.g. for starting (and stopping) your selected script. Tmux sessions always have a unique name by which they can be identified, e.g. middleware for the Middleware session. This is especially useful in case a tmux session could not be destroyed after a program crash: If a new session with the same name gets started from the LCC, the old session gets overridden.
The script that takes care of these sessions also writes command line outputs of the running programs into .../software/../lcc_script_logs. For example, the script to start and run the middleware is called tmux_middleware.bash and can be found in lab_control_center/bash. If you want to find out why your program crashed, the contents of this folder might be useful, in addition to log messages in the system and other custom error reports. You can find this folder for remote deployment as well (on the NUCs).
This folder only appears after you have started a simulation. It is created by the LCC - relative to the LCCs location - to store logs of the running script and Middleware. Some of its parts are deleted with each simulation - recording, Labcam, Middleware, HLC and remote_script logs. These change / become invalid with each new run. |
On HLCs, the same folder exists (for the guest user), also at .../software/../lcc_script_logs. It gets deleted and recreated (including its contents) every time a new remote simulation is started. |
Zusätzlich zu obigem Output erzeugt der CPM Logger mit jeder Ausführung Log-Dateien mit dem Namen Log_#Datum_#Uhrzeit.csv. Diese werden im selben Ordner erstellt, in dem das LCC aufgerufen wurde.
Dort finden sich außerdem auch Logs des LCC Childs, das sich um die Ausführung externer Programme kümmert. Diese Logs folgen dem Muster Log_child_process_#Datum_#Uhrzeit.csv und beinhalten ausschließlich Fehlermeldungen für schwerwiegende Fehler. Sie werden auch in der Kommandozeile ausgegeben, sind jedoch hier auch nach bspw einem Absturz des LCC zu sehen (falls es während der Laufzeit zu Fehlern im Child kam).
Most scripts started by the LCC run in tmux sessions (for more information, see above). These sessions have distinct names.
Tasks with a limited runtime are managed using fork and the resulting PID, e.g. for sending reboot commands to the vehicles. These tasks are not observed by the crash checker, as they are not strictly part of a running simulation and are not supposed to be always online. Tmux offers a more convenient way to manage tasks, to detach them from the LCC and to observe if they are still online, and is thus used for any simulation-related externally started program (User-provided script, Middleware, IPS...) |
Sessions exist for the Middleware and your script (if a locally running simulation was started and a valid script was selected). There also exist sessions for the labcam, position detection and other vital features of the LCC (if they are activated).
The integrated crash checker checks regularly - during a simulation - if all these tools are still running. To simplify the process, we only look up if the according tmux sessions exists, which in most cases is enough to detect a crash of the contained program.
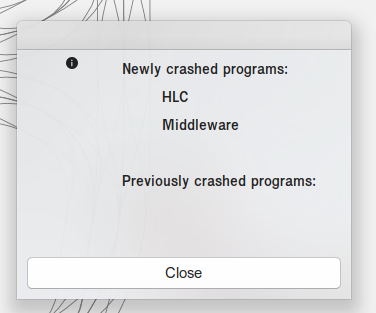
In case of an error, a LCC log entry is created and an additional popup window (which needs to be closed manually) warns the user about the undesired behaviour.

If you deploy your script locally, the process described above can be used to check if your script and the middleware are still running.
Take a look at this page. The crash checker also monitors running tmux sessions on the NUCs, if they have been deployed and the simulation is still running.
The round trip time is a measurement for the time (here: in milliseconds) a direct message exchange with instant answers takes between two participants within the network. It may differ with network load or may even produce no results in case of serious connection problems. Thus, regular RTT measurements provide a simple metric for the current quality of the connection to participants in the network and its stability.
The LCC regularly sends RTT measurement requests as long as no simulation is running (to prevent network overload).
These messages are received by different participants, which can send an answer to this request. It consists of their source_id (e.g. vehicle or hlc), and additional information to make sure that the answer is up-to-date etc.
The LCC either waits for these messages until a timeout occurs, or waits for some additional time after receiving the first message to determine when - approximately - the latest answers arrive.
These messages - for HLC and vehicles - are then processed to show the user the current best and worst RTT measured for each of the two participant types, the percentage of requests with missing replies since the start of the RTT measurement (since the last simulation) and the all-time worst RTT.
If no replies were received for some time (10 seconds), then all participants of that type are assumed to be turned off. The according data structures are reset and the UI does not show any information regarding the RTT of the participants anymore.
Picture of the LCC monitoring bar including information about the RTT, when no measurements could be made (because the participants are offline).
![]()
TODO: Insert image with example for working RTT measurement.
A small indicator has been added that shows the user how long the experiment has been running. It is also part of the monitoring bar. It displays hours, minutes and seconds (if they are greater than zero).
![]()
The following datatype is used to measure the RTT:
struct RoundTripTime {
    string source_id; //To find out where the msg came from and to not answer to own msg

    boolean is_answer; //If true, do not respond to this msg, as it already is an answer to an RTT request
    octet count; //Counter to not mix up old with new RTT requests
};The implementation of the calculation of the RTT as well as answering / sending RTT requests is part of the cpm library. They can be activated using the activate function, e.g. for the HLC:
cpm::RTTTool::Instance().activate("hlc");Here, hlc implies that this participant is responsible for measurements regarding the HLC, and answers to HLC RTT requests. You do not need to take care of this - HLC measurements are part of the autostart program on the NUCs.
The LCC includes some more tools to aggregate the calculated RTTs and to display them in the UI.